Basic rasterization / Draw with emojis
Discovering basic algorithms to render lines, shapes, curves, and filling them.
Introduction
An image is represented on a digital screen using pixels. A pixel is the smallest addressable unit of a digital screen, which means, when controlling a screen, we cannot control anything visually smaller than a pixel. Most screens are composed of a 2-dimensional array of pixels.
Rasterization is the task of turning an image, described in vector graphics, into a pixel-map (bitmap) on the screen – which pixels are used to render the image.
Algebra and Geometry give us equations to describe shapes and lines, but when these shapes are projected on an array of pixels, they are continuous functions living in a digitized space. Consider a line, which can be described by the equation y = ax + b. For all values of x, there is a corresponding y. This is a continuous function, but when drawing on a screen, you have to work with a discrete two-dimensional array of pixels. Rasterization would involve taking the continuous line, and figuring out which specific pixels to use to draw the line.
What does it have to do with drawing with Emojis?
Imagine if each pixel was represented using an emoji. The pixel is on - the emoji is showing, the pixel is off - the emoji is not showing. Abstracting that, one could render any vector shape using emojis.
This abstraction provided the idea of a fun JavaScript library I wrote - LegraJS which lets you draw using Lego like bricks. The bricks could be replaced with emojis :)
Crude and Quick
Rasterization can get really complicated in the real world, where one has to think about speed, memory, visual perception, anti-aliasing, etc. But in this blog post, I only talk about the simplest and the easiest methods.
I will discuss the methods used in LegraJS to draw basic vector primitives - lines, polygons, ellipses, bézier curves, etc.
Let's first define an abstract function to draw a pixel at (x, y), i.e. draw an emoji at the location. This function is invoked in the sample code that follows.
// EMOJI_SIZE is the size of emoji in the font being used
function drawEmoji(x, y) {
  // We round the numbers to the nearest pixel
  const actualX = Math.round(x) * EMOJI_SIZE;
  const actualY = Math.round(Y) * EMOJI_SIZE;
  // Draw emoji at actualX, actualX on your preferred medium
  // e.g. on canvas:
  var ctx = canvas.getContext('2d');
  ctx.fillText('😀', actualX, actualY);
}
Lines
In the interactive demos I have created for this post, a grid cell represents a pixel. Try moving the end points to change the line, and see which pixels are used to render the line. Turn on the the emoji switch to see those pixels rendered as emojis.
In algebra, a line could be represented by the equation y = mx + c, here m represents the slope of the line and c represents the value where the line meets through the y-axis.
In graphics and animation, a common function, lerp (Linear Interpolation) is used to return a number between two other numbers. lerp is based on the above equation that represents a line.
// Here t is between 0.0 and 1.0
function lerp(start, end, t) {
    return start + t * (end - start);
}
This function can be extended to 2-dimensions to represent points (x,y) for different values of t. But, what values of t should we use? If we divide the line into N sections, we use t = 1/N.
Now, what is the appropriate value of N?
We know the two endpoints of the line, we can tell if the change in y is more than change in x or vice-versa. The number N is the larger of the two changes. N = Max(|y2 - y1|, |x2 - x1|) or in javascript const N = Math.max(Math.abs(y2,y1), Math.abs(x2, x1)).
Here's the final function:
// Draw a line from (x1, y1) to (x2, y2)

function drawLine(x1, y1, x2, y2) {
  const dy = y2 - y1;
  const dx = x2 - x1;
  const n = Math.max(Math.abs(dx), Math.abs(dy));
  const ninv = n === 0 ? 0 : 1 / n;
  const xStep = dx * ninv;
  const yStep = dy * ninv;
  let x = x1;
  let y = y1;

  drawEmoji(x, y);
  for (let step = 0; step < n; step++) {
    x += xStep;
    y += yStep;
    drawEmoji(x, y);
  }
}
Polygons
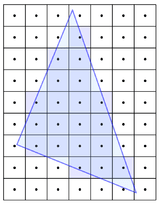
Now that we have tackled lines, drawing polygons is easy. A polygon is essentially connecting adjoining vertices with a line.
Filling a Polygon
One common way to fill a polygon is by using the Scan-Line Filling Algorithm. The idea is to scan the shape using horizontal lines (scanlines). The scanlines go from top of the polygon to the bottom. For each scanline, we determine at what points does the scanline intersect with the polygon. We arrange these intersecting points from left to right.
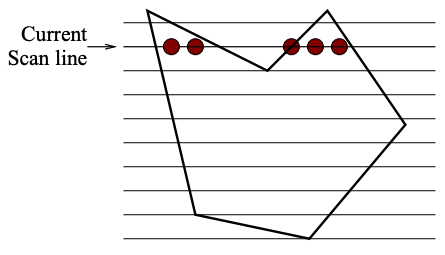
As we go from one point to another, we switch from filling mode to non-filling mode; and toggle between the states as we encounter each intersection point on the scan line. There is a bit more to consider here, specifically edge cases and optimization; more on this can be found here: Rasterizing polygons, or expand the following section for pseudocode.
We define two data structures (tables) to hold data about the polygon edges.
👉🏼 First, a global Edge Table (ET) of all the edges sorted by the Ymin value. If the edges have the same Ymin values, then they are sorted by their Xmin coordinate value.
👉🏼 Second, an Active Edge Table (AET) where we keep only the edges that intersect with the current scanline.
Following describes the data structure in each row of the tables:
interface EdgeTableEntry {
  ymin: number;
  ymax: number;
  x: number; // Initialized to Xmin
  iSlope: number; // Inverse of the slope of the line: 1/m
}

interface ActiveEdgeTableEntry {
  scanlineY: number; // The y value of the scanline
  edge: EdgeTableEntry;
}
After initializing the Edge Table, we perform the following:
1. Set y to the smallest y in the ET. This represents the current scanline.
2. Initialize the AET to be an empty table.
3. Repeat the following until both AET and ET are empty:
(a) Move from ET bucket y to the AET edges whose ymin ≤ y.
(b) Remove from AET entries where y = ymax, then sort the AET on x.
(c) Fill in desired pixel values (draw an emoji) on scanline y by using pairs of x coordinates from the AET.
(d) Increment y by 1, i.e. the next scanline.
(e) For each non-vertical edge remaining in the AET, update x for the new y
(edge.x = edge.x + edge.iSlope)
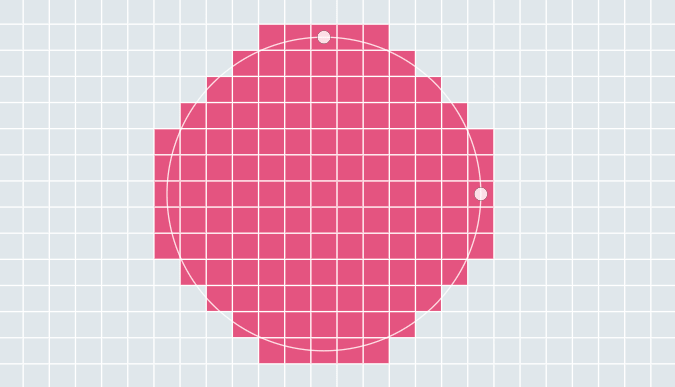
Ellipses (and Circles)
Let's first define a couple of key properties of an ellipse:
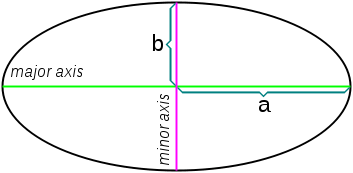
- semi-major axis
ais half of the length of the major axis that runs through the center of the ellipse, its focus point, and ends at the perimeter of the ellipse. - semi-minor axis
bis the line orthogonal to the semi-major axis, with one end at the center and the other end at the perimeter.
When a = b, the ellipse is a circle.
The most common algorithm to rasterize a circle is the Midpoint circle algorithm. This was adapted by Bresenham and generalized for ellipses. I have been using McIlroy's algorithm, which builds on Bresenham's work.
The links to the algorithms describe them in more detail. Following is the quick javascript implementation:
// xc, xy is the center of the ellipse
// a, b are the lengths of the semi-major and semi-minor axes
function drawEllipse(xc, yc, a, b) {
  let x = 0;
  let y = b;
  const a2 = a * a;
  const b2 = b * b;
  const crit1 = -(a2 / 4 + a % 2 + b2);
  const crit2 = -(b2 / 4 + b % 2 + a2);
  const crit3 = -(b2 / 4 + b % 2);
  let t = -a2 * y;
  let dxt = 2 * b2 * x;
  let dyt = -2 * a2 * y;
  const d2xt = 2 * b2;
  const d2yt = 2 * a2;

  const incx = () => {
    x++;
    dxt += d2xt;
    t += dxt;
  };

  const incy = () => {
    y--;
    dyt += d2yt;
    t += dyt;
  };

  while (y >= 0 && x <= a) {
    drawEmoji(xc + x, yc + y);
    if (x !== 0 || y !== 0) {
      drawEmoji(xc - x, yc - y);
    }
    if (x !== 0 && y !== 0) {
      drawEmoji(xc + x, yc - y);
      drawEmoji(xc - x, yc + y);
    }
    if ((t + b2 * x <= crit1) || (t + a2 * y <= crit3)) {
      incx();
    } else if (t - a2 * y > crit2) {
      incy();
    } else {
      incx();
      incy();
    }
  }
}
Filling an Ellipse
The scanline algorithm used for filling polygons can be adopted to work with Bresenham's Ellipse algorithm described above. Unlike a polygon, an ellipse is symmetrical, so what happens in one quadrant of the ellipse could be reflected to the other three quadrants. I have adopted the implementation described here: Drawing Ellipses Using Filled Rectangles
Bézier curve
Bézier curves are used to model smooth curves in vector graphics. Often complex paths can be constructed using a series of bézier curves. (Aside: These curves are also used in defining easing functions in UI animations, or in easing robotic movements)
A bézier curve is defined using four parameterized points. Two end points of the curve, and two control points. Try moving these points to see what pixels get rendered:
For bézier curves, I often end up using bezier.js which is really amazing. The two main methods I use for rasterization is length() which computes the length of the curve; and getLUT(n) which extrapolates n points on the curve. When using the length of the curve as n, one can estimate enough points on the curve to rasterize them. To get higher resolution for sharper curves, the value of n can be doubled.
// Bexier curve from point a to b, with p1 and p2 as the control points
function bezierCurve(a, p1, p2, b) {
  const bezier = new Bezier(a, p1, p2, b);
  const luts = bezier.getLUT(bezier.length() * 2);
  luts.push(b);
  this.drawEmojis(luts); // luts is an array of x,y coordinates
}
Quadratic curve
A quadratic curve is essentially a bézier curve with only one control point (or you could imagine a bézier curve where both the control points are the same).
Fortunately, bezier.js supports this as well
// Quadratic curve from point a to b, with p1 as the control points
function bezierCurve(a, p1, b) {
  const bezier = new Bezier(a, p1, b);
  const luts = bezier.getLUT(bezier.length() * 2);
  luts.push(b);
  this.drawEmojis(luts); // luts is an array of x,y coordinates
}
Epilogue
This post is, essentially, me aggregating some notes and thoughts I compiled when writing Legra. Note that I did not actually compile together a final library that does draw everything using emojis, though all the interactive demos in this post do have an emoji mode switch on top. I'm hoping there are enough tools in this post to let one create such a library.
The interactive demos here are inspired from Amit Patel's Red Blob Games blog.