How to emulate hand-drawn shapes / Algorithms behind RoughJS
A dive into graphics algorithms used in RoughJS - A graphics library that lets you draw in a sketchy, hand-drawn-like, style.
Introduction
RoughJS is a small-ish (<9kB) JavaScript graphics library that lets you draw in a sketchy, hand-drawn-like style. It lets you draw on <canvas> and with SVG. This blog post is to address the most common issue filed with RoughJS: How does it work?
A bit of history
Charmed by images of hand-drawn graphs, diagrams, and sketches; like I true nerd, I wondered what if there were a way to draw such figures through code. Emulate hand-drawing as close as possible and yet be legible and programmable. I decided to focus on primitives - lines, polygons, ellipses, and curves, creating a full 2D graphics library. Charting/Diagramming libraries and apps could be built on top of it.
After some quick research, I came across this paper by Jo Wood and others, titled Sketchy rendering for information visualization. The techniques described here formed the basis of the library, especially for drawing lines and ellipses.
I wrote the first version in 2017 which only worked on Canvas. Once the problem was solved, I lost interest. A year later I was working a lot with SVG, and decided to adapt RoughJS to also work with SVG. I also redesigned the API to be more basic and focus on the simple vector graphic primitives. I shared the 2.0 version of Hacker News and, surprisingly, it blew up. It was the second most popular post of ShowHN in 2018.
People have since created some amazing things with RoughJS — Excalidraw, Why do Cats & Dogs..., roughViz charting library, to name a few.
Now let's get to the algorithms....
Roughness
The fundamental concept behind emulating hand-drawn shapes is randomness. When you draw anything by hand, no two shapes will be exactly the same. Nothing is exact. So, every spatial point in RoughJS is adjusted by a random offset. The amount of randomness is described by a numeric parameter called roughness.
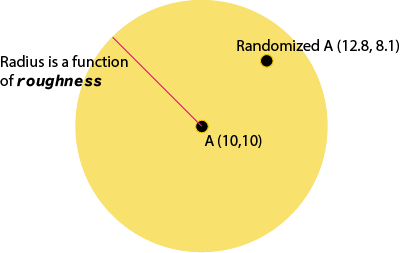
Imagine a point A and a circle around it. A is now replaced by a random point within that circle. The area of this circle of randomness is controlled by the roughness value.
Lines
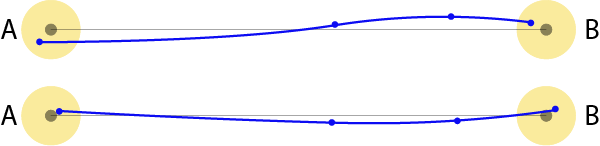
Hand drawn lines are never straight and often develop a bowing curvature (described here). We randomize the two end points of the line based on the roughness. Then we also pick two other random points around the 50% and 75% marks along the line. Connecting these points by a curve gives the bowing effect.
When drawing by hand, people sometimes go quickly back and forth on the line. This could be either to highlight the line, or just as an adjustment to the straightness of the line. It looks something like this:
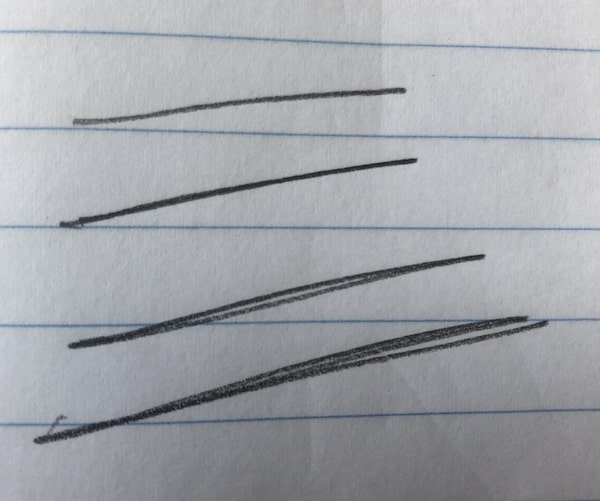
To give this extra sketchy effect, RoughJS draws the line twice to make it feel more sketchy. I do plan to make this more configurable in the future.
Try sketching lines on this interactive canvas surface. Adjust the roughness to see the lines change:
When drawing by hand, longer lines tend to get less straight and more curvy. So, the randomness of the offsets to create the bowing effect are a function of the line's length and the randomness value. This, however, does not scale for really long lines. In the image below, for example, concentric squares are drawn with the same random seeds - i.e. they are essentially the same random shape, but scaled differently.
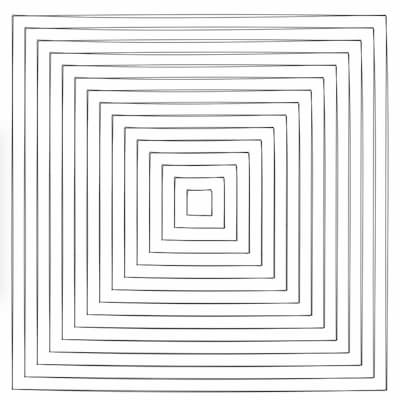
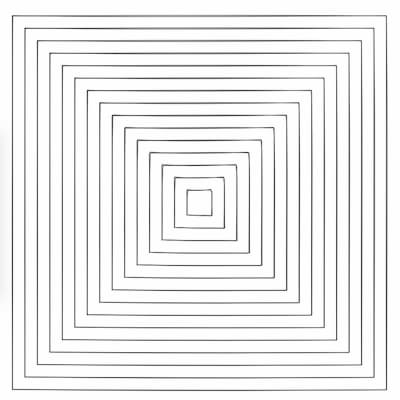
You will notice that the edges on outer squares tend to look a bit more rough than the inner ones. So, a dampening factor is also added based on the length of the line. The dampening factor is applied as a step function at different lengths.
Ellipses (and circles)
Take a piece of paper and draw a bunch of circles as quickly as your can, in one continuous motion. Here's what it looks like when I did that:
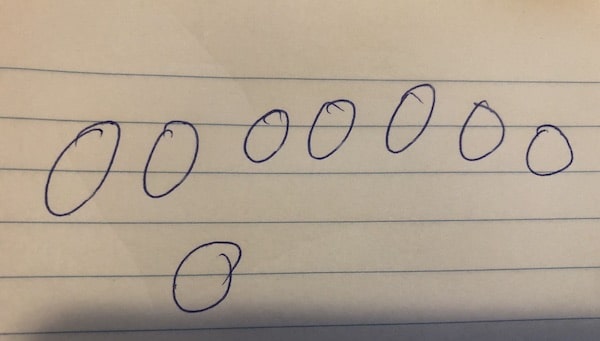
Notice that the start and end point of the loop don't actually meet unless you are very careful. RoughJS tries to achieve this while making it look more complete (adapted from the giCenter paper).
The algorithm finds n points on an ellipse, where n is determined by the size of the ellipse. Each point is then randomized by its roughness. A curve is then fitted through these points. To achieve the ends not meeting effect the second to last point does not meet the first point. Instead, it joins the second and third points.
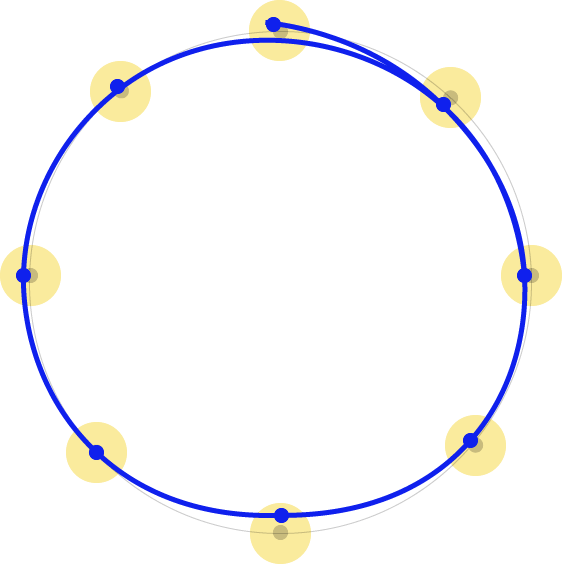
A second ellipse is also drawn to give it a more closed-loop, and extra sketchy effect.
Try sketching ellipses on this interactive canvas surface. Adjust the roughness to see the shapes change:
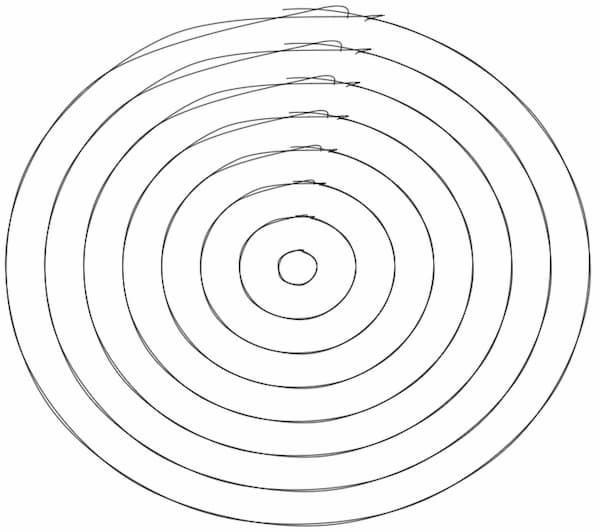
As in the case with lines, some of these artefacts get more accented if the same shape is scaled to different sizes. In ellipse, this is more noticeable because the relationship is quadratic in nature. In the image below, notice the circles have the same shape, but the outer circles look more rough.
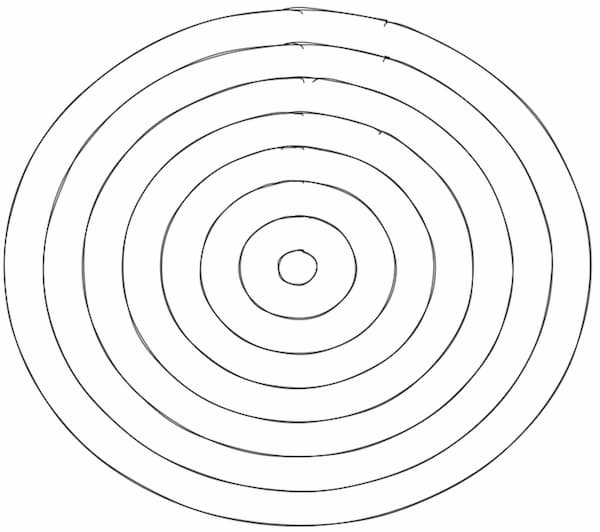
The algorithm now auto-adjusts itself based on the size of the shape by estimating more points on the circle (n). Following is the same set of circles generated with auto-adjust.
Filling
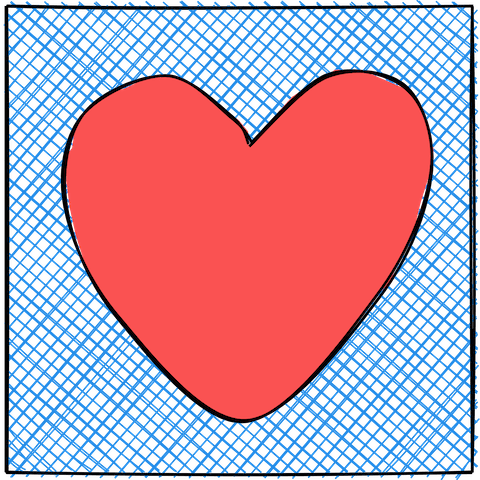
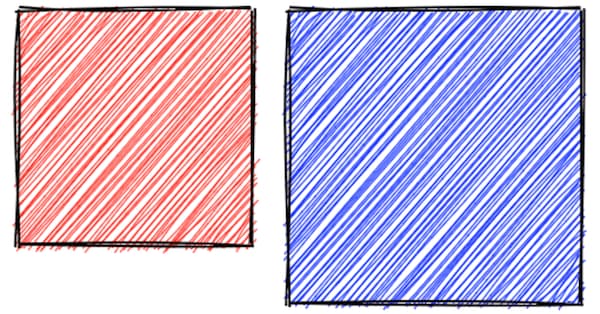
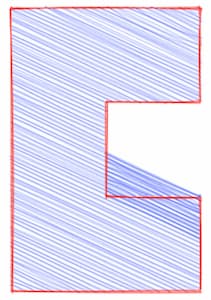
A common way to fill a hand-drawn shape is using hachure lines. As in hand-drawn sketches, lines do not stay within the outlines of the shape. They are also randomized. The density, angle, width of the lines is configurable.
Filling squares like the example above is easy, but you get into some trouble when filling all sorts of shapes. For example, concave polygons (where angles can be more than 180°) often lead to problems like these:
In fact the above image is from a bug report in an earlier version of RoughJS. Since then I have updated the hachure filling algorithm to an adapted version of Scanline fill technique.
The Scan-Line Filling Algorithm can be used to fill any polygon. The idea is to scan the polygon using horizontal lines (scanlines). The scanlines go from the top of the polygon to the bottom. For each scanline, we determine at what points does the scanline intersect with the polygon. We arrange these intersecting points from left to right.
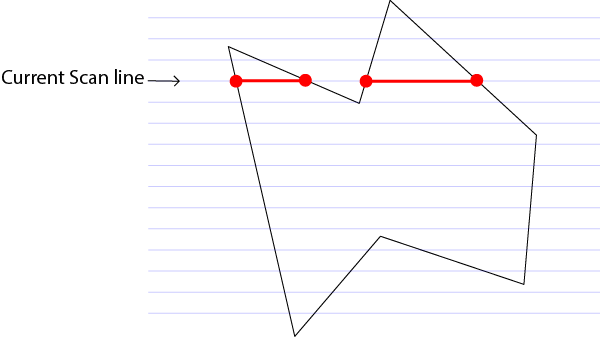
As we go from one point to another, we switch from filling mode to non-filling mode; and toggle between the states as we encounter each intersection point on the scan line. There is a bit more to consider here, specifically edge cases and how to optimize the scan; more on this can be found here: Rasterizing polygons, or expand the following section for pseudocode.
We define two data structures (tables) to hold data about the polygon edges.
👉🏼 First, a global Edge Table (ET) of all the edges sorted by the Ymin value. If the edges have the same Ymin values, then they are sorted by their Xmin coordinate value.
👉🏼 Second, an Active Edge Table (AET) where we keep only the edges that intersect with the current scanline.
Following describes the data structure in each row of the tables:
interface EdgeTableEntry {
  ymin: number;
  ymax: number;
  x: number; // Initialized to Xmin
  iSlope: number; // Inverse of the slope of the line: 1/m
}

interface ActiveEdgeTableEntry {
  scanlineY: number; // The y value of the scanline
  edge: EdgeTableEntry;
}
After initializing the Edge Table, we perform the following:
1. Set y to the smallest y in the ET. This represents the current scanline.
2. Initialize the AET to be an empty table.
3. Repeat the following until both AET and ET are empty:
(a) Move from ET bucket y to the AET edges whose ymin ≤ y.
(b) Remove from AET entries where y = ymax, then sort the AET on x.
(c) Fill in pixels on scanline y by using pairs of x coordinates from the AET.
(d) Increment y by appropriate value defined by the hachure density, i.e. the next scanline.
(e) For each non-vertical edge remaining in the AET, update x for the new y
(edge.x = edge.x + edge.iSlope)
In the following interactive, each square represents a pixel. Move the vertices to change the polygon and see what pixels would traditionally get filled in.
For a Hachure Fill, the scan lines are incremented in steps based on the specified hachure line density and each line is drawn using the line algorithm described above.
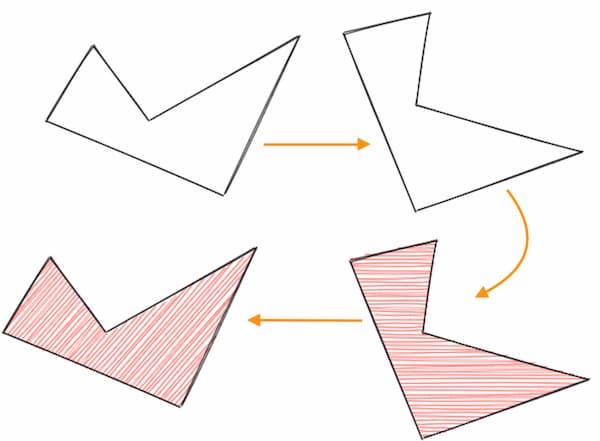
This algorithm, however, is designed for horizontal scan-lines. To achieve various hachure angles, the algorithm first rotates the shape itself by the desired hachure angle. Scan-lines are calculated for the rotated shape. The computed lines are then rotated back by the hachure angle in the opposite direction.
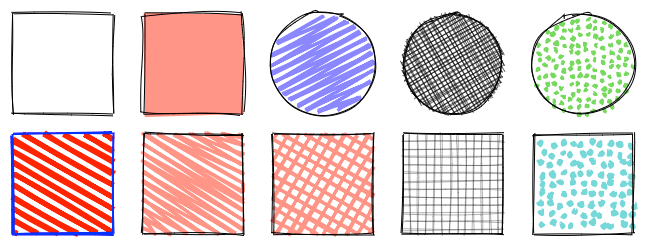
More than hachure fills
RoughJS also supports other fill styles, but they are all derived from the same hachure algorithm. A cross-hatch is drawing hachure lines at an angle and then again with angle + 90°. A zig-zag tries to connect one hachure line to the previous. Draw tiny circles along the hachure lines to get a dotted pattern.
Curves
Everything in RoughJS gets normalized to curves. Lines, Polygons, Ellipses, etc. So creating a sketchy curve is natural extension. In RoughJS you provide a set of points on the curve, and Curve fitting is used to translate these into a set of Cubic Bezier Curves.
Each Bezier curve has two endpoints, and two control points. By randomizing these based on roughness, one can create sketchy curves in the same fashion.
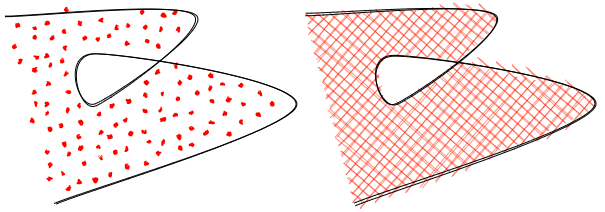
Filling Curves
Filling curves, however, requires the opposite. Instead of normalizing everything to a curve, the curve is normalized to a polygon. Once you have a polygon, the scan-line algorithm can be used to fill the curved shape.
One can sample the points on a curve at a desired rate by using the Cubic Bezier Curve equation.
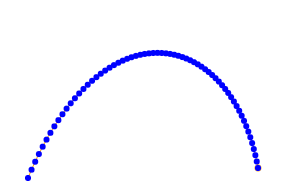
Using a sampling rate based on the hachure density can give you enough points to fill the shape. But it's not very efficient. If the section of the curve is sharp, you'd want more points. If the section of the curve is nearly a straight line, you'd want fewer points. One technique is to figure out how curvy/flat the curve is. If it's too curvy, split the curve into two smaller curves. If it's flat, then just treat it as a line.
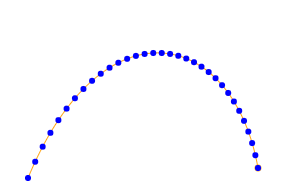
The flatness of the curve is calculated using the method described in this blog post. The flatness value is compared to a tolerance value to decide whether to split the curve or not.
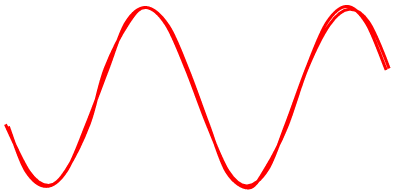
Here's the same curve with a tolerance level of 0.7:
Based on the tolerance alone, this algorithm nicely provides enough points to represent a curve. It does not, however, efficiently get rid of unneeded points. A second parameter, distance helps with that. The technique uses the Ramer–Douglas–Peucker algorithm to reduce the points.
Following are the points generated with distance values of 0.15, 0.75, 1.5, and 3.0
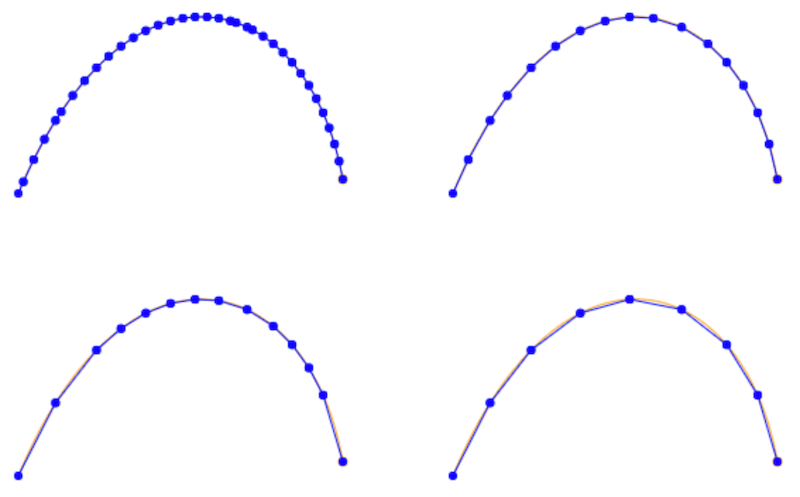
Based on the roughness of the shape, one can set an appropriate value of distance. Once you have all the vertices of the polygon, curved shapes fill nicely:
SVG Paths
SVG Paths are very powerful and can be used to create all sorts of amazing drawings, which also makes them a bit tricky to work with.
RoughJS parses the path and normalizes the path into only three operations: Move, Line, and Cubic Curve. (path-data-parser). Once normalized, the shape can be drawn using techniques described above to draw lines and curves.
The points-on-path package combines the path normalization and curve point sampling to estimate the appropriate points on the path.
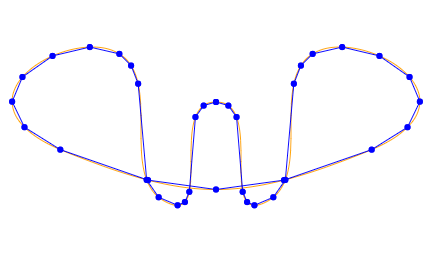
Following is rough estimation of points for the path M240,100c50,0,0,125,50,100s0,-125,50,-150s175,50,50,100s-175,50,-300,0s0,-125,50,-100s0,125,50,150s0,-100,50,-100
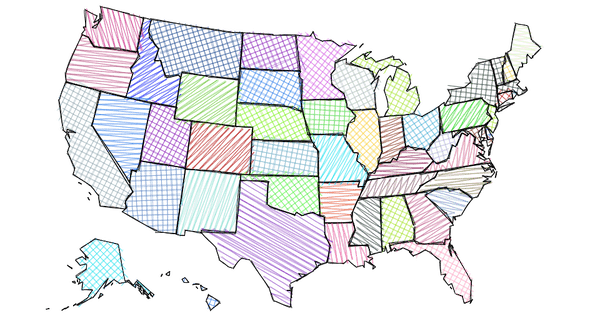
An SVG example I like to share often, a sketchy map of the United States:
Try RoughJS
Visit the website or the Github repo or the API docs. Follow the project on Twitter @RoughLib.